After I had written that post, I had some notes left over because I didn't want to make my text too long. But I think they're interesting enough for me to revisit the cod genome and write a new post.

The Atlantic cod, Gadus morhua
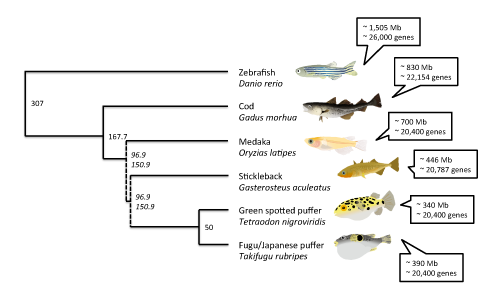
I've already highlighted some of the basic stats of the Atlantic cod genome and compared them to some other fish genomes:
The basic genome stats reveal a pretty standard vertebrate genome, if there is such a thing. The total (haploid) size is estimated at approx. 830 million base pairs, a bit lower than previous estimates, and the number of identified genes is 22,154 (20,095 protein coding). The closest related fish species with a sequenced genome is the three-spined stickleback, Gasterosteus aculeatus, with a genome of approx. 446 million base pairs and 20,787 identified genes. The best studied fish genome, that of the zebrafish Danio rerio is quite a bit longer, with about 1.5 billion base pairs, but the gene content is similar with about 26,000 identified genes.
Aside from the zebrafish and three-spined stickleback genomes, the japanese pufferfish (Takifugu rubripes), green-spotted pufferfish (Tetraodon nigroviridis) and medaka or Japanese ricefish (Oryzias latipes) genomes have been sequenced. The medaka genome sequence is about 700 million base pairs long with about 20,400 identified genes. The two pufferfish genomes are significantly shorter, with about 390 and 340 million base pairs respectively, but with similar gene contents - about 20,400 for both species. These species represent the latest 150 - 300 million years of fish evolution, more or less, which is a great coverage, but considering the vast radiation and diversity of fishes it's a pretty thin representation - five orders out of about forty, not including the largest one Perciformes (perch-like fishes). For comparison, the genomes of over thirty different species of mammal have been sequenced (with varying quality, it should be said).

Evolutionary tree of the fish species with sequenced genomes. Divergence times between the species (million years ago) are according to timetree.org estimates, except those in cursive which are estimates from Donoghue and Benton in Trends. Ecol. Evol. 22(8), 2007. The estimate of 307 MYA for the divergence of zebra fish is probably an overestimation. Click on the image to see it larger.
Sequencing and putting together a "working" genome sequence is an arduous task. It includes the sequencing itself of innumerable small pieces of the broken-up DNA strands, then the assembly of these short fragments, called contigs, into longer pieces that can then be mapped to the different chromosomes. In this process it's also important to annotate the content of the genome - which means to identify different genes, repeat elements et c. All of this is done because the information on where different genes or other elements are located in the genome is just as important as the sequence itself. This long process is why it may take several years between the start of a genome sequencing project and the announcement and release of the sequence.
No available genome sequence, from any species, currently accounts for 100% of the genome - some parts simply seem to evade the sequencing process, either due to mistakes in the sequencing or because of the specific qualities of the particular genome region. It's also often the case that many of the short contigs cannot be assembled into large stretches of sequence, called scaffolds. This can cause a lot of trouble when it comes to puzzling the whole genome sequence together and making a map of where everything is located on the chromosomes. The zebrafish genome sequence, which is probably the best-sequenced teleost, encompasses about 87% of the projected whole genome length, which is really rather good and very "workable".
The cod genome seems to be of reasonable quality. About 90% of the estimated whole genome size is covered, but only 74% is part of the long scaffolds. The rest is made up by contigs with a minimum size of 500 base pairs that could not be put together into scaffolds. Still, it seems that these contigs represent highly variable regions, and most protein coding genes can be located within the assembled scaffold sequences. This is a good sign of quality. However, there a lot of gaps in the scaffold sequences - small regions that could not be read in the sequencing process. Together these gaps reduce the amount of the genome that was actually sequenced and assembled to about 46% of the estimated whole genome size. Since the vast majority of the already known genes could be identified, and the total gene amount is comparable to the other fish genomes, this might not be a huge problem. But it's important to remember that any genome sequencing project produces a limited dataset, not an actual whole genome.
I mentioned earlier that the cod genome database doesn't show any chromosome data. That is because the cod genome hasn't been mapped to chromosomes yet. Instead the long scaffold sequences have been compared to an existing linkage map, a collection of sequence stretches containing linked Single Nucleotide Polymorphisms, or single positions of the genome which are known to vary between individuals within the species. In this way much of the genome assembly was put together into 23 large so called linkage groups. Each different linkage group represents a number of genes that are linked with each other, which in turn is likely to represent a significant cohesive segment of a chromosome. It's these linked stretches of the genome sequence that provide the primary useful data for comparative analyses between different genomes. In total the genome sequence represented on these linkage groups is about 332 million base pairs, a match to the 46% of the genome that was actually sequenced and assembled.
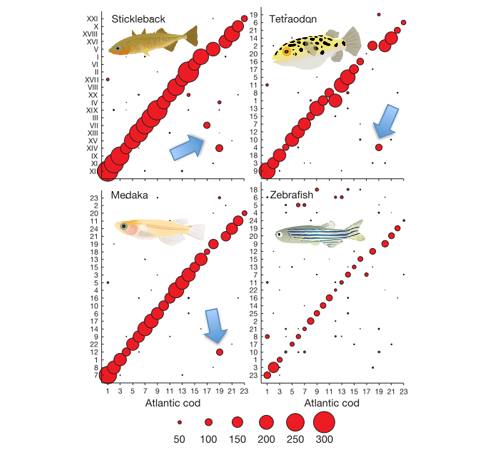
By comparing these groups of linked genes to the chromosomes of the zebrafish, medaka, stickleback and green-spotted pufferfish it's possible to see that, for the most part, the same genes are linked together in all the fish genomes. This is represented by the red circles in the image below. The larger the circle, the more genes are shared between each cod linkage group and the different chromosomes in the other species.

Ref: Adapted from B. Star et al (see below).
In this way we can see that, for instance, linkage group 1 in the cod is likely to correspond to chromosome 23 in the zebrafish, 7 in the medaka, XII in the stickleback (stickleback genomes are enumerated with Roman numerals for some reason), and 9 in the pufferfish. This means that the linkage groups are likely to represent the different cod chromosomes, and that the cod shares the same basic genome organization as the other known fish genomes. There is one curious exception though - a whole block of genes in the cod linkage group 19 seem to have "changed place" compared to the other genomes. This is indicated by the blue arrows.
Overall, it seems the quality of this genome assembly is similar to the already available fish genomes. The authors of the cod genome paper note that in quality it's most similar to the medaka genome, which is not as good as the zebrafish or stickleback genomes, but better than the two pufferfish genomes and, it should be said, the majority of mammalian genomes. In my experience this means that the cod genome should be spotty in some regions, but by and large it probably contains large stretches with good "workable" sequence. I've started using it a little bit in my own research and I'm sure it's going to prove its worth.
Star, B., Nederbragt, A., Jentoft, S., Grimholt, U., Malmstrøm, M., Gregers, T., Rounge, T., Paulsen, J., Solbakken, M., Sharma, A., Wetten, O., Lanzén, A., Winer, R., Knight, J., Vogel, J., Aken, B., Andersen, Ø., Lagesen, K., Tooming-Klunderud, A., Edvardsen, R., Tina, K., Espelund, M., Nepal, C., Previti, C., Karlsen, B., Moum, T., Skage, M., Berg, P., Gjøen, T., Kuhl, H., Thorsen, J., Malde, K., Reinhardt, R., Du, L., Johansen, S., Searle, S., Lien, S., Nilsen, F., Jonassen, I., Omholt, S., Stenseth, N., & Jakobsen, K. (2011). The genome sequence of Atlantic cod reveals a unique immune system Nature DOI: 10.1038/nature10342
Nice post! Now the Oreochromis niloticus genome is available from Perciformes just as a side note ;)
ReplyDeleteHi,
ReplyDeletegreat post. I wanted to know where did you get the information about the gene content for each fish. The numbers that I found on the internet are different for some of the species.
Thanks.
Thanks! I got the gene content numbers from Ensembl.org, which keeps some stats over the currently available teleost fish genome assemblies. So these numbers, except for the Cod's, are not from papers. Good zebrafish genome stats are also available from the Sanger website - http://www.sanger.ac.uk/Projects/D_rerio/
ReplyDeleteI only wanted some sort of rough comparative numbers, so I pooled together known protein coding genes, projected protein coding genes, novel protein coding genes and RNA genes, and rounded up the number. That might explain why you're finding different numbers. These kind of estimations have quite a margin of error anyway...
Hi Daniel, I really like your post! I was just wondering where can we find the information on "a certain scaffold is in which linkage group"? or rough estimation of the distances between two interested scaffolds if they belong to one chromosome? I can't find the information about the 23 linkage group (http://www.biomedcentral.com/1471-2164/11/191) on either Ensamble Gadus morhua V65.1 (http://www.ensembl.org/Gadus_morhua/Info/Index) or UCSC Genome browser (http://codgenome.no/cgi-bin/hgGateway?clade=vertebrate)
ReplyDeleteThank you very much!
Cecilia
Thanks! I don't know if I could help, but I can try! Could you please e-mail me at daniel.ocampo-daza[at]neuro.uu.se? It's easier to answer like that.
Delete